Using High-Frequency Electroencephalogram in Visual and Auditory-Based Brain-Computer Interface Designs
Evoked potentials obtained from brain’s electrical activity (i.e. electroencephalogram [EEG]) in response to both visual and auditory oddball paradigms have been used in brain-computer interface (BCI) designs, as a means of achieving external control directly from the brain. This is obviously useful for the severely disabled, but it can also be used for creative applications in music performance. We present here a novel approach that combines conventionally used low frequency information with higher frequency in gamma band to enhance the performance of such BCI designs. EEG data were obtained from three and two subjects for the visual and auditory paradigms, respectively. In the visual paradigm, the subjects perceived common pictures like TV, radio, lamp etc., while for the auditory paradigm, the subjects listened to simple computer-generated sounds like “ding”, “exclamation”, “chimes” etc. Recognition of target picture or sound focused by the subject using the EEG data allows a control mechanism to be designed, which can then be used to control the movement of a wheelchair, to trigger a sound sample, or to create harmonic variations over a synthesised piece of music. The results confirm that using the higher frequency gamma band, which has been mostly overlooked in BCI studies, along with low frequency in the P300 temporal region, give better classification accuracies for both paradigms. This study offers motivation warranting further exploration on the link between low and high frequency of evoked potentials from EEG for use in visual and auditory based BCI designs.
An electroencephalogram (EEG) based brain-computer interface (BCI) is a system that allows direct communication or control of an external device using electrical signals obtained from the brain. Fully invasive methods that place electrodes in the grey matter of the brain are not popular due to risks involved, and while partially invasive EEG-based BCI (that places the electrodes on the outside of the brain but inside the skull) are less risky, these are also not as popular as non-invasive EEG-based BCI, where the placement of the electrodes are on the surface of the scalp.
There are several approaches to implementing a non-invasive EEG-based BCI such as those based on transient evoked potential from oddball paradigm (Donchin et al., 2000) or from steady-state evoked potential (Wilson et al., 2011), mental activity (Palaniappan 2006), motor imagery (Ince et al., 2009) and slow cortical potential (Hinterberger et al., 2004). In this paper, the focus is on improving the performance of BCI based on transient evoked potentials using oddball paradigm where both the visual and auditory paradigms were studied. The main advantage of using evoked potentials is that they are automatically generated by the brain in response to a stimulus and require minimal training. Therefore, they can be used effectively to drive a BCI.
The basic blocks of a typical BCI are illustrated in Figure 1. During a paradigm (like oddball, motor imagery etc.), brain activity (i.e. EEG) is measured using one of the modalities. These signals then undergo a conversion from analogue to digital form. As the signals normally contain noise, the next block involves a pre-processing stage to reduce artifacts and other undesired components. This is followed by a feature extraction block (such as extraction of time, frequency, joint time-frequency or spatial domain features). Finally, the features are classified and translated to control commands for applications like alphanumeric speller (Donchin et al., 2000), Brain Computer Musical Instruments (BCMI, Miranda and Brouse 2005) or interactive instrument for real-time scoring of moving images, as for the EMO-Synth (Vermeulen 2012).
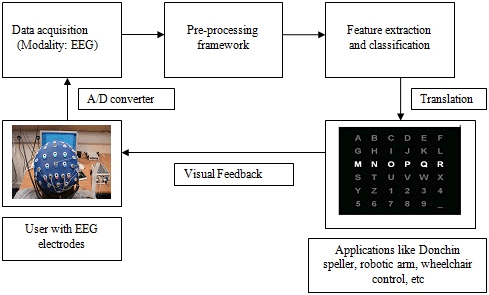
In an oddball paradigm, two different classes of stimuli are used: a target and a non-target. The two classes of stimuli are presented in a random sequence with the target stimulus appearing rarely. Users are instructed to respond to each occurrence of the target stimulus by either pressing a button or keeping a count or just recognising the target, while ignoring the non-target stimulus. Under such circumstances, when the target stimulus appears, a change in the evoked potential occurs in the captured EEG, and when this change is recognised correctly, it can be translated into useful control mechanisms such as selecting characters in a speller or controlling movement of a wheelchair, but it can also provide control variables for sound effect parameters, discrete events that trigger changes in harmonic pitches, etc. Obviously, such designs would prove to be useful for the severely disabled.
It is commonly believed that the change in the response when a target stimulus occurs can be detected, by extracting the low frequency P300 component, which is normally evoked around 300 ms after stimulus onset. The frequency range of this component is normally limited to 12 Hz and hence the EEG is often low-pass filtered to this range. However, in this study, we embark to show that the change also occurs in a higher frequency region of gamma (around 30–48 Hz) and that utilising this extra component in the high frequency range can result in better recognition performance.
Methodology
Data from five subjects were used in the study, three for the visual paradigm and two for the auditory paradigm where the former were obtained from the BCI group based at the École polytechnique fédérale de Lausanne (EPFL, Hoffman et al., 2007), while the latter was recorded in our biosignal analysis lab using a Biosemi Active Two device. The active electrodes used in the system removed the necessity to clean the scalp prior to inserting the electrodes. However, conductive gel was still required to minimise the impedance level to below 5 kΩ. The whole set-up required less than 15 minutes to be completed.
Visual Paradigm
The dataset provided by the EPFL BCI group consisted of EEG data recorded using oddball paradigm where the pictures depicted in Figure 2 were used as stimuli. Each participant took part in four sessions, with each session consisting of six runs. During each run, one of the six images acted as targets. Each image was flashed for 100 ms followed by a 300 ms inter-stimulus interval.

The pre-processing and classifier approaches used here were similar to the study by Hoffman et al. in 2007. Data from three able-bodied subjects from eight optimal electrodes (in the standard locations of Fz, Cz, Pz, Oz, P3, P4, P7, P8) 1[1. See the Wikipedia article “10-20 system (EEG)” for details about the placement of electrodes for EEG tests and experiments.] were used, as these gave good classification performance in the previous study (Hoffman et al., 2007). The data were referenced to the average of the mastoid channels and a forward-reverse Butterworth band-pass filter with cut-off frequencies of 1 Hz and 12 Hz was used to filter the data. The sampling frequency was 256 Hz and each trial was one second in length (i.e. 256 samples). To remove eye blinks and artifact activity, windsorising as described by Hoffman et al. was implemented. Percentile values of 10 and 90 were used from each channel to cap the minimum and maximum values, respectively, in the channel. This resulted in conventionally used features in the spectral range of 1–12 Hz to form a 256-length vector. Features from each channel were concatenated to give the final feature vector.
The aim of this study was to explore the influence of features from the gamma band on the classification accuracy. Hence, the EEG was also filtered in the 30–48 Hz spectral band and energy was calculated in the time range of 200–600 ms using a window size of 32 samples to form a three-element gamma energy vector. Feature fusion of both the low and high frequency features resulted in a vector of length of 259 for each channel.
The recorded data consisted of 40–48 blocks, where each block consisted of the six images being flashed in random sequence. The data were divided into four sets. A three-fold cross validation method, using Bayesian LDA software provided by EPFL BCI group was used to obtain the classification accuracies. The classifier was trained on three sets and the fourth set was used as a testing dataset. The outputs of the classifier were added incrementally, i.e. the outputs were aggregated after each trial. The maximal output after considering all the six flashes in a trial was taken as the predicted target. Averaged performances from cross-validation runs were computed. All programs for data analysis were written using Matlab software.
Auditory Paradigm
Similar to the visual paradigm, data was recorded from target and non-target stimuli presented in a random manner. Four standard computer audio files — “ding”, “exclamation”, “chimes” and “recycle” — were selected to form the auditory stimuli of four class BCI. The audio tone was played for 100 ms, while the inter-stimulus interval (ISI) was selected to be 750 ms. Data from eighteen electrodes positioned at FP1, FPz, FP2, F7, F3, Fz, F4, F8, T3, C3, Cz, C4, T4, T5, P3, Pz, P4 and T6 were recorded. These locations were chosen based on another study by De Gurtubay et al. in 2004. The participant was presented with the target cue audio tone, and pressing the “Enter” key started the experiment. The auditory stimuli were presented for 40–48 blocks. During the experiment, the participant was requested to close his or her eyes and count the target tones, while ignoring the non-target tones. Two two level audio tones (one for the target and another for the non-target) were used during the experiment. Etyomic insert earphones were used for better audio quality as these have flat frequency responses. All the pre-processing, feature extraction and classification steps used were similar to the visual paradigm.
Evaluation Metric
Though the classification accuracy is a good measure of the performance, it is not sufficiently good in comparing different BCI systems, as the number of targets could vary along with the response time taken. One objective means of comparing the utility of BCIs is by their information throughput or bit rates. The bit rate B in bits/minute is used to characterise the performance of BCI systems and can be computed according to the following equation below (Wolpaw et al., 2002):

In the equation above, N denotes the number of different commands that a user can select (i.e. the number of classes), p denotes the probability that a command is correctly recognized by the system (i.e. the accuracy rate) and t is the time in seconds that is needed to select one command.
Results
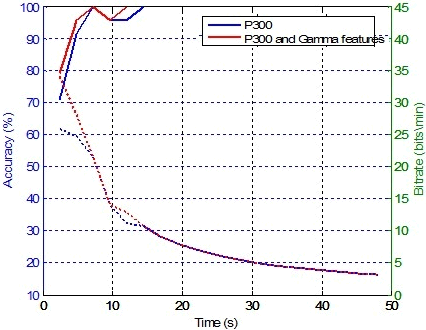
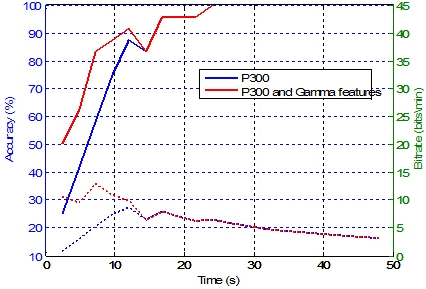
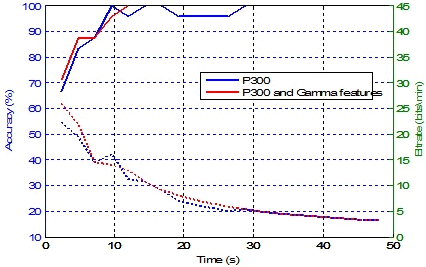
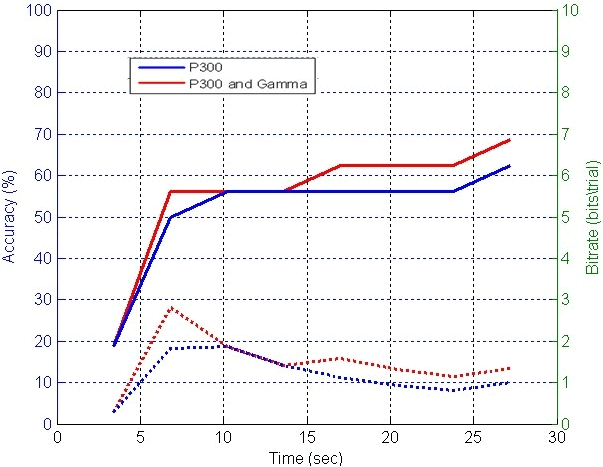
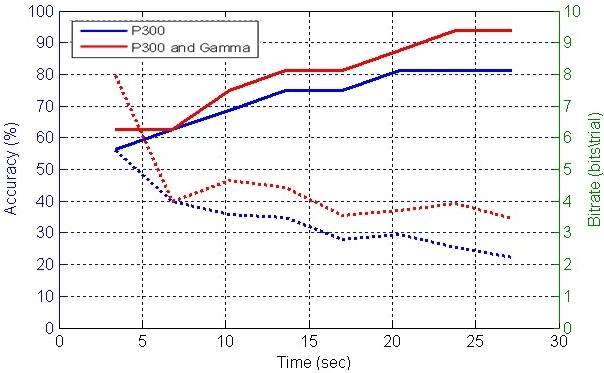
The performances due to feature fusion were compared with the performance using low frequency features alone. Figures 3 through 5 illustrate the classification accuracies (solid lines) as well as the bit rates (dotted lines) for the visual paradigm for all three participants. The cross-validated accuracies were averaged and bit rates calculated using Wolpaw et al.’s definition (Eq. 1). The results from the other two participants for the auditory paradigm are shown in Figures 6 and 7. The y-axis represents the accuracies and bit rates, while the x-axis represents the time (i.e. as the trial blocks advance).
It can be seen from these figures for the visual paradigm that by adding information from the gamma band frequency range, the classification accuracy is increased, especially with smaller number of trials used. The improvement can also be seen with the higher bit rates. The classification eventually reaches 100% (after about 30 seconds for all participants) for both low frequency and fusion features. For the auditory paradigm, the improvement in accuracy and bit rate is similar with fusion features performing better.
Conclusion
The inclusion of higher frequency gamma band (30–48 Hz) energy features in the 200–600 ms together with the conventionally used low frequency features has resulted in improved performance to distinguish between target and non-target stimuli in both visual and auditory paradigms for BCI designs. The results in this case confirm the work of others in the auditory oddball paradigm (De Gurtubay et al., 2001; De Gurtubay et al., 2004) showing that the activities in gamma-band EEG are coupled with low frequency components.
Bibliography
Donchin, Emanuel, Kevin M. Spencer and Ranjith Wijesinghe. “The Mental Prosthesis: Assessing the speed of a P300-based brain-computer interface.” IEEE Transactions on Rehabilitation Engineering 8/2 (June 2000), pp. 174–179.
García De Gurtubay, Iñaki, Manuel Alegre, Alberto Labarga, Armando Malanda and Julio Artieda. “Gamma Band Activity in an Auditory Oddball Paradigm Studied with the Wavelet Transform.” Clinical Neurophysiology 112/7 (July 2001), pp. 1219–1228.
_____. “Gamma Band Responses to Target and Non-Target Auditory Stimuli in Humans.” Neuroscience Letters 367/1 (August 2004), pp.6–9.
Hinterberger, Thilo, Stefan Schmidt, Nicola Neumann, Jürgen Mellinger, Benjamin Blankertz, Gabriel Curio and Niels Birbaumer. “Brain Computer Communication and Slow Cortical Potentials.” IEEE Transactions on Biomedical Engineering 51/6 (June 2004), pp. 1011–1018.
Hoffmann, Ulrich, Jean-Marc Vesin, Touradj Ebrahimi and Karin Diserens. “An Efficient P300-Based Brain-Computer Interface for Disabled Subjects.” Journal of Neuroscience Methods 167/1 (January 2008), pp. 115–125.
Ince, Nuri F., Fikri Goksu, Ahmed H. Tewfik and Sami Arica. “Adapting Subject Specific Motor Imagery EEG Patterns in Space-Time-Frequency for a Brain Computer Interface.” Biomedical Signal Processing and Control 4/3 (July 2009), pp. 236–246.
Miranda, Eduardo Reck and Andrew Brouse. “Toward Direct Brain-Computer Musical Interfaces.” NIME 2005. Proceedings of the 5th International Conference on New Instruments for Musical Expression (Vancouver: University of British Columbia, 26–28 May 2005), pp. 216–219.
Palaniappan, Ramaswamy. “Utilizing Gamma Band to Improve Mental Task Based Brain-Computer Interface Design.” IEEE Transactions on Neural Systems and Rehabilitation Engineering 14/3 (September 2006), pp. 299–303.
Vermeulen, Valery. EMO-Synth website. 2012. http://www.emo-synth.com [Last accessed 16 May 2012]
Wilson, John J. and Ramaswamy Palaniappan. “Analogue Mouse Pointer Control via an Online Steady State Visual Evoked Potential (SSVEP) Brain-Computer Interface.” Journal of Neural Engineering 8/2 (April 2011). [doi: 10.1088/1741-2560/8/2/025026]
Wolpaw, Jonathan R., Niels Birbaumer, Dennis J. McFarland, Gert Pfurtscheller and Theresa M. Vaughan. “Brain-Computer Interfaces for Communication and Control.” Clinical Neurophysiology 113/6 (June 2002), pp. 767–791.
Social top