Observing in Real Time the Making of a New System of Musical Notation
Electroacoustic practices, born practically under our eyes in the middle of the 20th century, give us the opportunity to observe the process of the constitution of a system of musical notation in real time.
Since the introduction of electricity into the art of music — the American Thaddeus Cahill’s Telharmonium 2 dates from 1906 1[1. The first known electric instrument dates from 1759, Jean-Baptiste Thillaie de la Borde’s (1730–1777) electric keyboard. But the American Thaddeus Cahill’s (1867–1934) Dynamophone or Telharmonium is actually the first to offer sounds entirely generated by electricity, beginning in 1896, thanks to use of the tonewheel, an electromechanical system. At that time, the loudspeaker still didn’t exist, and the music played on the Dynamophone was broadcast over the telephone network of New York City. The Hammond organ, based on the principle of the Dynamophone, appeared later, in 1935.], while the recording process began even earlier at end of the 19th century 2[2. In 1877, Thomas Edison developed a system of recording on cylinders with a stylus, as well as a carbon microphone. In 1885, Graham Bell invented the phonograph, which made it possible to engrave a recording directly to disc. In 2008, we discover that the Frenchman Edouard-Léon Scott of Martinville had invented the phonautographe in 1860 (long before Edison).] — we have witnessed a spectacular broadening of all the concepts of musical notation, which had been considered virtually immutable for at least 300 years in the West. The 20th century saw the arrival of a new type of musical notation due to the emergence of a new instrumentarium and the new genres of music associated with it. Today, with the broadening of sound criteria — notably variations in timbre — brought about through the development of new devices and new techniques, it is no longer possible to simply write the name of an instrument from the Classical orchestra — such as violin, flute or piano — at the beginning of a line on the score. The same is true for pitch, dynamics and other performance indications, which can be varied and executed with the greatest refinement, at an extraordinary range and all the way down to the auditory threshold of perception. Not to mention specific efforts focusing on spatial movement, the multiplication of sound layers and extremely complex rhythmic activity.
Very rapidly, a number of notational proposals appeared to facilitate all the details of interpretation, all the positions on listening and all the sound sources used.
But the constitution of these new forms of notation is not completely synchronous with the emergence of new musical æsthetic; it follows at a variable temporal distance and seems to answer to its own laws. By situating the recent history of research into symbolic notation of electroacoustic music within the general history of the emergence of writing, and not only musical notation, we can recognize different stages that return cyclically at the appearance of each new rupture in technology. The standardization of these new forms of writing can then be considered as a later stage and as the starting point for a new type of creation.
Responding to the Broadening of Musical Criteria
Twentieth-century music, in adopting electroacoustic techniques, has given rise to a new instrumentarium: prototypes such as the Telharmonium (1906), Theremin (1917), ondes Martenot (1928) and the Trautonium (1929) have inevitably led to new sounds and, as a consequence, to the need for new systems of notation representing the new timbres and new techniques of composition and performance. In addition to their ability to produce a multitude of unheard-of sounds far beyond the notes of the Western scale, these first instruments — as well as their descendants, from the first analogue synthesizers to effects boxes to digital software and synthesizers — offer, by way of their potential for amplification and their technology, access to sounds with an almost-infinite range of intensity and dynamics, and are capable of obtaining extreme decibel levels that are impossible for an instrumentalist to produce using the traditional instrumentarium. Regular and very long glissandi became simple to obtain, offering a continuum of pitch in addition to the fixed scales that characterize many traditional Western instruments.
Sound recording onto a physical support has made it possible to transform every sort of sound into a musical object, sometimes on the scale of a single sample. Variations in colour, timbre and texture have become infinite. Unlimited repeated listening to all these recorded sounds — slowed or accelerated — allows the ear to sharpen its perception and augment its exigence for precision in the description of sound.
The first transcriptions of electroacoustic music weren’t made in response to a musical need, but rather to a juridic need.
As with all music, electroacoustic music reflects the ephemeral character of the oral tradition as a procedural approach that comes to life through performance; its quality depends on the competence of the composer making it. And since electroacoustic music is recorded directly on a support, the need for notation for its transmission is strongly diminished. In a certain way, it is already notated, or at least fixed and “memorized”. Perhaps we still need to note a few technical specifications about the sound — the number of tracks, the spatial distribution of channels for playback, the necessary quality of speakers — in order to inform the performer in the moment of its projection in space. In fact, the first transcriptions of electroacoustic music weren’t made in response to a musical need, but rather to a juridic need: registering the works with organizations protecting intellectual property (the SACEM in France) that legally only recognized works by way of their written score. The second justification for the existence of transcriptions is the undeniable pedagogical usefulness of a visual document to aid in listening and teaching. Nothing is better than a drawing to explain the different sorts of door squeaks heard in Pierre Henry’s Variations pour une porte et un soupir (1963), or a synthetic sound created by a noise generator, or the digital processing of a digital sound signal. When the smallest details and nuances rival each other in importance, composers themselves don’t hesitate to invent pictograms to help them orient themselves, as much during the process of composition as in the preparation of performance and listening scores that can be helpful for teaching or useful in a concert presentation.
In contrast, even more than with pure electroacoustic music, in mixed and electronic music for which musicians generate and transform sound live in performance, it is necessary to find an effective means of description to make repeat performances possible. Often, the transmission of the work is done with help from a reference recording, or orally by the intermediary of one of the performers or composers themselves. Several forms of transcription have been and are being experimented with to preserve electroacoustic music and mixed music, in order to be able to transmit them and to re-produce them. 3[3. An entire book is consecrated to the subject: Portraits Polychromes, n° 21, Musique et technologie : Préserver — Archiver — Re-produire, Ina, 2013.] The objective of graphic transcription and notation, in this case, is to memorize the musical interpretation and, afterwards, to share it.
First Stage: Descriptive Notation — Not Yet Prescriptive
This first stage, which one finds in any process of establishing a notation system, functions only for memory, aimed at conserving the integrity of the musical message. What results is the proliferation of notation more or less explicit in the representation of original sounds, more or less advanced in terms of abstraction.
Although today we have moved beyond this simple stage, regarding the graphic transcription of the sound art of the 20th century we nevertheless all too often hear remarks concerning the excessive subjectivity, or even pointlessness, of such graphic transcriptions. They are accused of being nothing more than æsthetic caprices, and above all, of little to no use for a performer, even one of good faith.
Let’s remember that the Western Classical notation of figures of notes on staves, once hand-drawn on paper and later printed, with scales for time and tempo, first took form in the eighth century, only arriving at its almost definitive form with Ars Nova in the 14th century: the five-line staff, key signatures, note forms and symbols for dynamics. Or, more than five hundred years to develop a form of notation, teach and disseminate it.
We could therefore also easily imagine spending another 500 years setting up a new notation system to encompass all the musical sounds that could be learned at the moment; this would constitute a prescriptive system designed prior to any execution using familiar symbols that would allow for reversibility in the sound construction. The goal being to go beyond the level of the first descriptive or memory phase and reach the stage of creation. Let’s not forget that many great composers of prescriptive music have often professed to compose based on listening: Messiaen, for example, was inspired by bird song. Or Stravinsky, inspired by his own instrumental playing, who wrote:
Yes, I write at the piano and I can’t complain. What’s more, I think it is a thousand times preferable to compose in direct contact with the sound material than to compose by imagining that matter. (Stravinsky 1962, 14)
These two approaches have been ceaselessly superposed: procedural (based on listening and gesture) and prescriptive.
After adopting various generalized units of measurement — the decibel (1923), hertz (1888), tempo expressed in beats per minute and the spectrogramme (all integrated into today’s devices for the production of sound) — new electronic instruments have become progressively standardized, first in their wiring 4[4. The MIDI norm was first presented in 1983.] but also in their formats. Today almost all synthesizers exist in virtual form, and sound processing is done using plugins that are integrated in the sequencers. But once the musical works have been composed and performed, we often lack a simple means for memorizing — and therefore identifying — both the dynamic effects (spatial movement and the evolution of intensity and volume curves over time) and the timbral evolution that led to the construction of each of the tracks in a mix. Signal analysis and advanced audio descriptions (spectrum, peaks, phase) began appearing in the 2000s and continue to improve. In short, we know how to conserve a recording of a complex piece, but we have a hard time re-composing it sound by sound.
Already aware of this risk, during the composition of his piece Anamorphées in 1985, the composer Gilles Racot recorded all the settings he had used in Syter, the ancestor of GRM Tools 5[5. A collection of sound processing tools for musicians developed by the Groupe de Recherches Musicales. The first version was released in 1992.], in a notebook. A good thing, because a few years later, once digital platforms had evolved so much that the original recording was no longer readable, he was able to re-compose these elements and recreate the same sounds.
The same is the case for Hugues Dufourt’s piece Saturne (1979), which a team of researchers decided to recreate 6[6. For the French research project Gamelan: an environment for the Management and Archiving of Music and Digital Audio (Gestion et Archivage de la Musique et de l’Audio Numérique). The project was funded by the Agence Nationale de la Recherche (ANR) in 2010–2012 and coordinated by IRCAM, INA-GRM, UTC and Emi-Music France.] in 2009, thirty years after its premiere. This work for electrified ensemble (22 musicians, including 4 performing on electronic instruments: ondes Martenot, organ, synthesizer and guitar) has been performed often, but was modified each time according to the availability of electronic instruments and the technical constraints unique to each concert. Finally, after the long, painstaking work undertaken by researchers trying to understand the (sometimes erroneous) handwritten indications in the scores of the various performers, and after an enquiry with various collaborators of the period, including the composer, it became clearly evident that the piece re-created in 2010 was not totally identical to the original. But at least the act of examining its re-production contributed to its safeguarding (Geslin 2013).
Research into Transcription Automatization
In 2016, the Groupe de Recherches Musicales possessed some 500 scores or graphic representations on paper, going as far back as the 1950s for Pierre Schaeffer’s first endeavours. Scrutinizing these outlines, we notice a constant attempt to automate transcription with the most sophisticated tools of each period: electromechanical systems such as the sonograph in the 1950s, which recorded the spectrum of a sound on a cylinder (by 2.4-second slice), through to digital tools such as the Acousmographe software (tool for listening analysis and transcription), first released in 1995 and in its 3.7.2 version as of 2013. The Acousmographe automatically displays the spectrum and waveform of a sequence of up to three hours, on a line calibrated in seconds. Today, the representations of music on paper familiar from the early days of electroacoustic music have been replaced with computer screen versions, beginning with the arrival of the first plugins for automatic recognition and highlighting of similarities between certain musical traits, such as Sébastien Gulluni’s Timbre Scope (2011). 7[7. Timbre Scope, developed for the analysis of electroacoustic music, carries out automatic segmentation. See Gulluni 2011.] Other software exists to assist in listening and sound analysis, notably iAnalyse (2007 by Pierre Couprie), inspired by the Acousmographe but specialized in the analysis of music that makes use of traditionally notated scores.
Abstract and Coded Symbols That Need to Be Learned
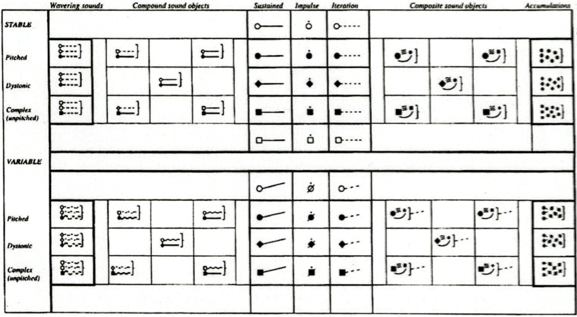
Certain symbols, compiled as libraries, have already gone in depth into the morphological description of sounds. The Sonova language, for example, was developed by the Norwegian Lasse Thoresen in the 1970s after the charts of typo-morphologic description of sound established by Pierre Schaeffer in his Traité des objets musicaux (Schaeffer 1966, 389–472) and of spectromorphology by the Englishman Denis Smalley (1995). Thoressen attributed a graphic symbol to each criteria of morphologic perception (mass, dynamics, harmonic timbre, melodic profile, mass profile, grain, allure) and each type, genre, class or species (pitch, intensity, duration). Over 300 symbols represent sounds in a language designed to be unambiguous. 8[8. This symbol library is accessible in the Acousmographe, a software that assist in the graphic transcription of sound, available on the site of the GRM.] The fact remains that, while awaiting the arrival of systems of assistance for semi-automated recognition, one must thoroughly learn all these symbols to render them operational — the case for a few musicologists, who in turn have taught other musicians.
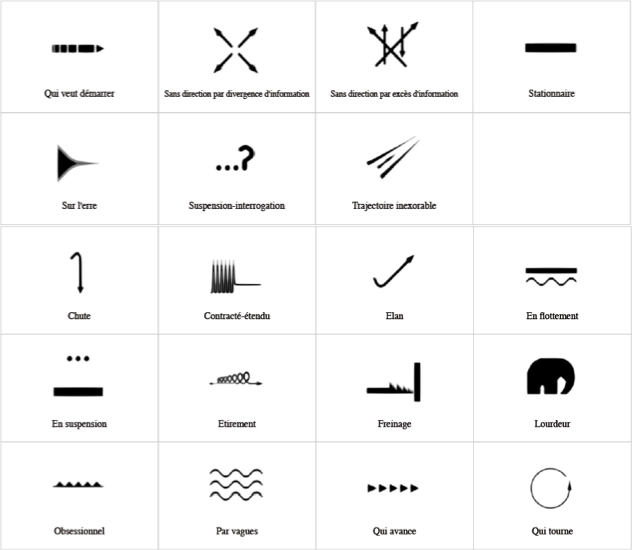
On the same order of ideas, the description of music using the Unités Sémiotiques Temporelles (UST), or Temporal Semiotic Units, developed by the Laboratoire Musique et Informatique de Marseille from 1991 to 1996, also rooted in Schaeffer’s approach and based on research into the signification of music during its reception, finally found a series of graphic symbols linked to its 19 figures of style describing the dynamic behaviour of sound and music 9[9. In 2016, these symbols were also integrated into the Acousmographe software.]
Finally, we have various proposals for symbols that individual enthusiasts have attempted to impose. But as the anthropologist Clarisse Herrenschmidt reminds us:
codes are technical languages, arbitrary, knowingly calculated and written by specialists for work by machines in production, military, financial and social industries. (Herrenschmidt 2010, III)
As with the Sonova language, the next phase of development for UST representations or for other symbolic notation systems for electroacoustic practices will consist of teaching it to the greatest possible number of potential users, for the idealized project of generalizing the morphological description of sound and music.
The Constitution of New Musical Notation
Excursions into the general history of writing can illuminate us concerning the lack of consensus between the various contemporary approaches to the graphic transcription of music. As with pictograms and ideograms (as in Chinese and Egyptian writing) that are composites of lines and simple figures, sometimes allegoric, through to designs that can at times be quite extravagant, in today’s musical transcriptions we encounter entire palettes of symbols, signs and codes that can only be understood by the initiated. One cannot yet speak of a writing system that has been widely disseminated.
Wang Xizhi (330–361), one of the most venerated Chinese masters of calligraphy, said:
Writing needs meaning, while calligraphy is expressed above all by form and gesture; it elevates the soul and illuminates the sentiments. (Cited in Mediavilla 2013, 7)
And so the symbols such as those defined in the Sonova and UST systems, as well as the forms and coloured drawings that musicologists invent today for the needs of representation in graphic transcriptions correspond to the definition of calligraphy. The ideogram of calligraphy is a figure that is not linked to a sound, it is pure writing; it cannot be said out of context, but it can be read. It is a moving sign whose value changes in function of context.
In the same way, the variable values that we attribute to each graphic representation in music are an indication that we are still only at a preliminary stage of writing: the absence of a notation system that associates a precise sound with a precise graphic symbol prevents all reversibility between image and sound. At best, we are at the beginning of hybridization in the modes of representation: the researcher Véronique Alexandre Journeau has demonstrated how graphic scores in ancient Chinese tablature describe dynamics in the form of ideograms accompanied by drawings and poetic passages (Alexandre Journeau 2015). Let us not forget that music does not primarily attempt to convey sense, as language does, but rather to touch listeners as deeply as possible, both sensorially and emotionally.
While calligraphy is intrinsically linked to the medium of paper, today our “medium” is the computer screen, where it is possible to correlate gestures, sounds and images, sometimes in real time.
Also note that it is not surprising that Schaeffer’s work on the morphology of sound first led to representations belonging to the domain of morphemes, rather than phonemes. 10[10. The phoneme is the smallest segment of writing based on phonetics, as in the Greek linear syllabic tradition with its complete alphabet achieved by 750 BCE.] The goal was to represent complex sound objects.
Knowing that historically the ideogram mutated very early into the phonogram (Christin 2009), we can hope that in our representations, we can also re-establish these links. Jean-François Champollion, the original Egyptologist, was himself quite surprised to discover that hieroglyphs referred also to a phonetic system.
Solutions may emerge from the use of new technologies such as machine learning or deep learning. But do we now possess a sufficient corpus of graphic transcriptions already realized that have been assembled in a database in order that we may obtain reliable results? This could be the basis for useful collaboration between researchers.
Second Stage: Completely Consummated Prescriptive Notation (In a Few Centuries?)
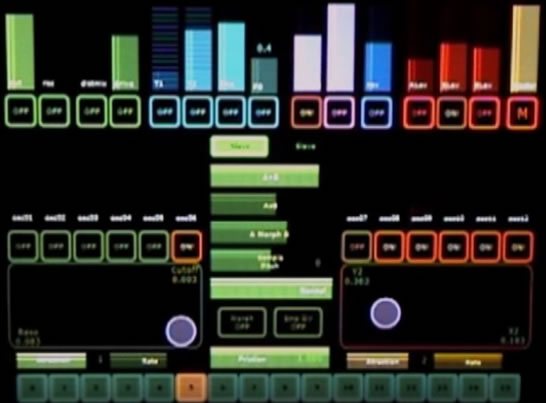
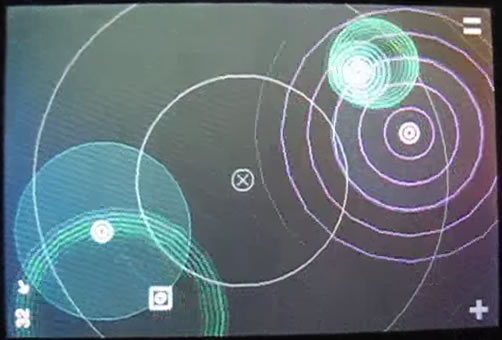
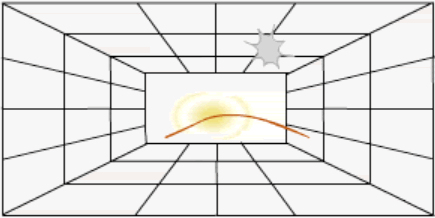
The task for us today remains complex because sounds and the instrumentarium are limitless and remain unfixed. The standardization of notation can only come with the standardization of instruments; for the moment, however, their multiplication only worsens the problem. Meanwhile, we must continue to describe individual sounds, all sounds, and then their aggregates (sound objects, samples) and development across time and space with the greatest possible precision. The decomposition of signals into digital data should allow this. Then with the aid of machines we will be able to re-compose the music. Certain researchers have already invoked “instrument scores” (Zénouda 2015, 252), where the interface between human and machine would be interlinked with graphic representation, as with certain video games based in sound such as Lemur (Fig. 3) and synthPond (Fig. 4), among others. 11[11. Lemur is a controller in the form of a multi-tactile device on which users can create their own control interfaces. A sequencer and game developed by Zach Gage, synthPond allows users to position and move “nodes” in a field and thereby let their “score” play in a 3D space. See, for example the YouTube video “synthpond” (3:23) posted by “wiretotheear” on 21 January 2009.] In this case, the computer monitor replaces the sheet of paper. The technological rupture consists in substituting data for the printing press, and replacing musical theory books with tutorials.
The anthropologist Clarisse Herrenschmidt, a specialist in the history of writing, has clarified its function:
Writing is the act of transferring and conveying the oral or inner word — language in its interiorized form and without utterance, thought in flux or the baggage of memory — to the fixedness of graphic signs. (Herrenschmidt 2010, 10)
In this way, the figuration of an act of the word leads to writing. And while speech is not a code, language already is one. This leads to a simple extrapolation of sound and music whereby we can consider the diverse range of figures encountered in graphic transcriptions of non-written Western music since the middle of the 20th century as a first step toward a system of notation. But in order to be labelled as notation, as writing, these new signs must be decipherable outside of the original context of their production.
Toward a New Æsthetic Field: Multimedia
All said, the entirety of these graphic transcriptions of sound and music distance us from the field of sound, moving us toward the visual field. Supports to aid the memory — for the most part paper, but earlier, parchment, clay tablets and even Paleolithic cave walls — function as a receptacle for gestures that produce symbols representing numbers, ideas and sounds. And so, the graphic representation of music has not been principally addressed to listeners, but rather to readers who — if, and only if, they are educated in music, can envision reversibility between listening and reading. Without reversibility, one graphic representation could result in different sound interpretations — a dialectic between auditory memory and visual memory comes into play.
Our recent transcriptions of music, which resemble ideograms more than phonograms, therefore respond principally to the laws of graphics, and only secondly to music, resulting in their proximity to graphic arts and multimedia. This new field of artistic exploration of the ambivalence between sound and image will very likely continue to develop.
In contrast with the tendency to create libraries of abstract symbols in the manner of Sonova, “free” graphic representations (which are the majority) play on the parallel between sound and visual media at the root of an intermedia art form. We note that they function on a perceptual scale greater than the coded representations of Sonova or UST, which work better with sound samples lasting on average a few seconds. Other types of representation (notably animated notation) are, however, more adapted to longer passages that may extend over several minutes.
In the following examples of research into the representation of long sequences, the Acousmographe was not used in all instances. The tools used determine the style of representation: Flash and QuickTime, for example, make it possible to visualize the cursor on the timeline.
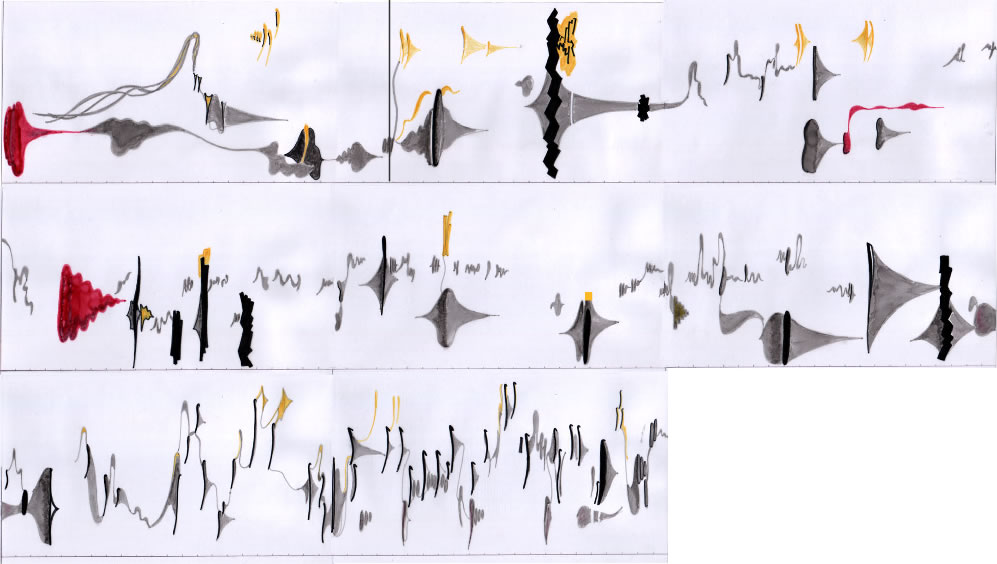
Another monolithic job was the synchronization of the visual elements point by point in Flash for the following three excerpts (Figs. 6–8) of the transcription of Bernard Parmigiani’s Étude élastique (Video 2).

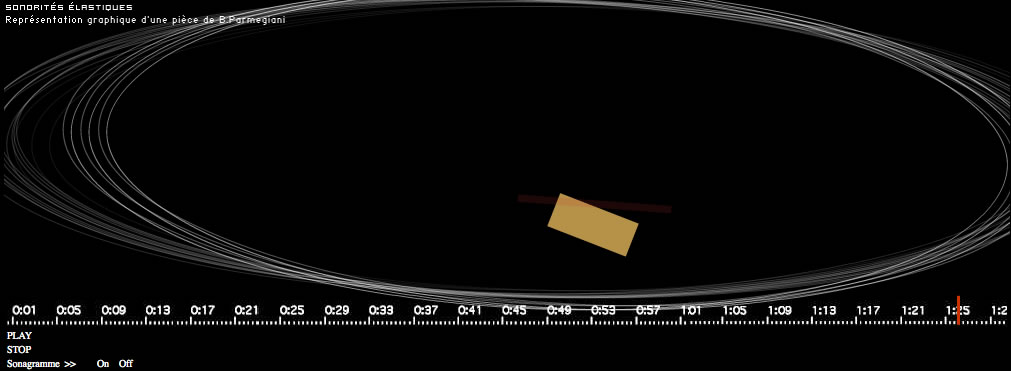
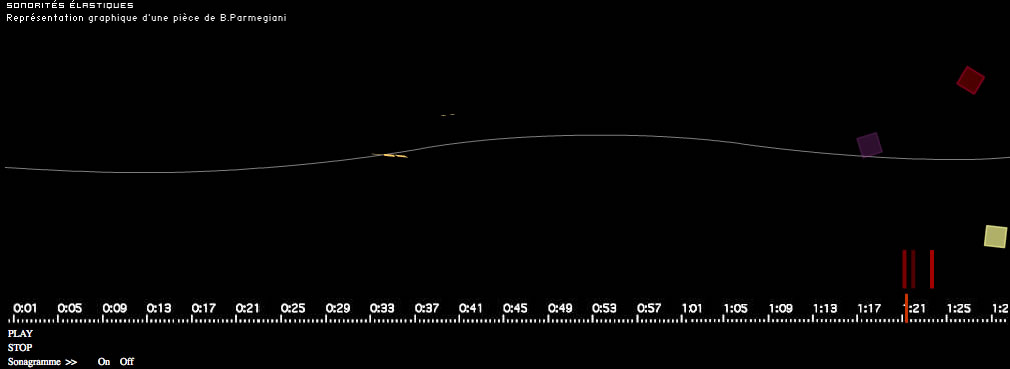
Notation and performance can be very subjective and we note there are no norms that exist for the notation of graphic elements. Therefore, Parmegiani’s work could very well be represented in another form than that proposed by Samuel Rousselier. In contrast to the linear approach that he chose — the timeline recalling the principal of reading from left to right — David Boisbourdin decided to develop a notation of the space (Figs. 9–10).
Nevertheless, the more we distance ourselves from graphic representation and we approach an analytical point of view, we note a few broad tendencies:
- General identification of the large-scale form of the work (divided in sections);
- Detailed identification of the notable sonic elements (sound objects);
- Analysis and representation using the UST (Temporal Semiotic Units) developed by MIM (Musique Informatique Marseille);
- Analysis and representation following the criteria of Denis Smalley’s spectromorphology…
Conclusion
The search for a notation system for electroacoustic music, originally arising out of simple juridical and pedagogical needs, rapidly led to the creation of a multitude of representations of a wide æsthetic variety but lacking any apparent coherence. Analysis of these transcriptions leads us to return to the source of the technological rupture that triggered them — the electrification of sound-producing instruments, recording and computing — in order to establish their links with the enormous, new electronic instrumentarium that appeared at the end of the 19th century. Today, more than fifty years after the first attempts at graphic transcription of electroacoustic music, following the model of the standardization of sound-producing devices, we turn to standardizing transcriptions that will perhaps make it possible to reproduce and even to recreate ex nihilo compositions for their performance. But before it can boast of a creative function, notation first functions as memory. Situating the history of research into electroacoustic notation in the general context of the invention of writing helps us to better appreciate the global coherence of its evolution: we have only heard the first murmurations of a new system of musical notation. This confrontation also allows us to confirm that our graphic representations are not addressed primarily at a listener but rather at a reader, hence the expansion into the realm of visual and multimedia creation.
Bibliography
Alexandre Journeau, Véronique. “Une notation musicale des images insufflant l’intuition du geste.” Son — Image — Geste, une interaction illusoire? Edited by Lenka Stranska and Hérvé Zénouda. Collection Ouverture philosophique. Paris: L’Harmattan, 2015, pp. 201–226.
Christin, Anne-Marie. L’image écrite ou la déraison graphique. Paris : Flammarion, 1995, -2009.
Gayou, Evelyne (Ed.). Portraits Polychromes, n° 21, Musique et technologie: Préserver — Archiver — Re-produire. Ina, 2013.
Gayou, Evelyne. GRM — Le Groupe de Recherches Musicales: Cinquante ans d’histoire. Paris: Fayard, 2007.
Geslin, Yann. “Saturne d’Hugues Dufourt, ou la préservation d’une œuvre avec électronique.” Portraits Polychromes, n° 21, Musique et technologie: Préserver — Archiver — Re-produire. Edited by Evelyne Gayou. Paris: Ina, 2013, pp. 127–144.
Gulluni, Sébastien. “Un système interactif pour l’analyse des musiques électroacoustiques.” Unpublished thesis under the direction of Gaël Richard, Télécom ParisTech, 2011. http://tel.archives-ouvertes.fr/pastel-00676691/document [Accessed 25 February 2017]
Herrenschmidt, Clarisse. Les trois écritures. Langue, nombre, code. Paris: Gallimard NRF, 2010.
Mediavilla, Claude. L’Abcdaire de la calligraphie. Flammarion scriptorial, 2013.
Schaeffer, Pierre. Traité des objets musicaux. Paris: Le Seuil, 1966.
Smalley, Denis. “La spectromorphologie, une explication de la forme des sons.” In Esthétique des arts médiatiques, Tome 2. Edited by Louise Poissant. Montréal: Presses de l’Université du Québec, 1995, pp. 125–164.
Stranska, Lenka and Hérvé Zénouda (Eds.). Son — Image — Geste, une interaction illusoire? Collection Ouverture philosophique. Paris: L’Harmattan, 2015, pp. 201–226.
Stravinsky, Igor. Chroniques de ma vie. Paris: Denoël, 1962, -2000.
Zénouda, Hervé. “Apport des SIC et des NTIC à l’analyse du “fait musical” contemporain.” Son — Image — Geste, une interaction illusoire? Edited by Lenka Stranska and Hérvé Zénouda. Collection Ouverture philosophique. Paris: L’Harmattan, 2015, pp. 247–254.
Social top